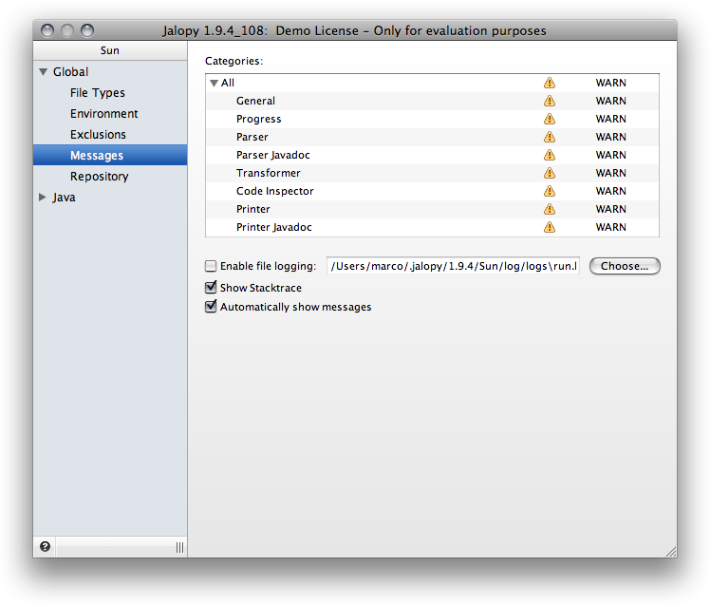
Controls the Jalopy message output. Given the sensitive nature of automatic source code processing, it is quite important to keep informed about what is going on during the formatting process. The default configuration should be sufficient for most users, so there should seldom arise the need to change anything here.
Jalopy provides different message categories for setting the logging verbosity level. Changing the threshold from ERROR to DEBUG successively displays more (albeit not necessarily more useful) messages.
General
General purpose chain for I/O activity and all sorts of stuff that doesn’t fit elsewhere.
Parsing
Message chain for messages related to the language parsing.
Javadoc parsing
Message chain for messages related to the parsing of Javadoc comments.
Transforming
Message chain for messages related to the post-processing of the generated parse tree.
Printing
Message chain for the main printing engine.
Javadoc Printing
Message chain for Javadoc printing related messages.
Use logfile
Normally, messages are only printed to the console or the message view of your IDE, here you can define that all messages should be written to a log file as well. This is most useful when you use Jalopy as part of an automated build process. Press the Choose... button to select the file you wish to write logging output to.
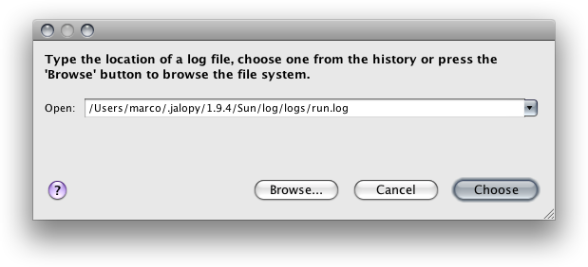
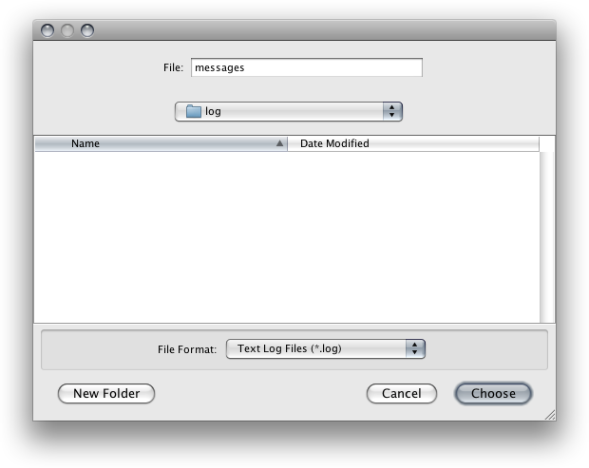
You can either directly enter a location into the combo box, choose one from the history, or press the Choose... button to display a file chooser that lets you interactively select a file.
Jalopy supports three different log file formats. A custom text format (.log), an HTML format (.html) and a flat XML format (.xml). These formats can only be selected via the file chooser.
Both the custom text format and the XML output are simple flat file formats, but the HTML option produces an hierarchical report similar to that generated by the Javadoc tool. Please note that this feature can be enabled from the Ant, Console and Maven plug-ins directly, so it should be normally left disabled here.
Since 1.0
Show stacktrace
Enables or disables the inclusion of the current execution stack trace with error messages. This proves useful in case you need to file a bug report as it reveals the source of the error.
Automatically show messages
When enabled, messages are automatically displayed when a formatting run finished. Otherwise you manually need to activate the corresponding view in order to access messages. This option only applies for the IDE plug-ins.


